案例场景
传感器能够直接观测到某行人的速度Vx,Vy,用卡尔曼滤波估算该行人的状态(包含速度和位置)
相关变量约定如下:
行人状态 $x = (p_x,p_y,v_x, v_y)^T$
P: 行人不确定性,协方差矩阵
F: 状态转移矩阵
Q: 过程噪声协方差矩阵
K: 卡尔曼滤波增益
H: 观测矩阵
R: 观测噪声协方差矩阵
step0:随机产生一批测量数据,包含二维速度测量值
import numpy as np
%matplotlib inline
import matplotlib.pyplot as plt
from scipy.stats import norm

m = 200 #measurements
vx = 20
vy = 10

mx = np.array(vx + np.random.randn(m))
my = np.array(vy + np.random.randn(m))
measurements = np.vstack((mx,my))
print(measurements.shape)
print('Standard Deviation of Acceleration Measurements=%0.2f'%np.std(mx))
print('You assumed %0.2f in R.'%R[0,0])
执行结果:
(2, 200)
Standard Deviation of Acceleration Measurements=1.04
You assumed 0.09 in R.
fig = plt.figure(figsize=(16,5))
plt.step(range(m), mx, label='$\dot x $')
plt.step(range(m), my, label='$\dot y $')
plt.ylabel(r'Velocity $m/s$')
plt.title('Measurements')
plt.legend(loc='best',prop={'size':18})
plt.savefig('measurements.png')
step1:初始化行人状态
包括x,y方向的位置和速度,及行人的不确定性,测量间隔时间dt
x: 行人状态初始值, 因未知,所以全设置为0
P: 行人不确定性初始值,不确定性很高
x = np.matrix([[0.0,0.0,0.0,0.0]]).T
print(x,x.shape)
P=np.diag([1000.0,1000.0,1000.0,1000.0])
print(P,P.shape)
执行结果:
[[0.]
[0.]
[0.]
[0.]] (4, 1)
[[1000. 0. 0. 0.]
[ 0. 1000. 0. 0.]
[ 0. 0. 1000. 0.]
[ 0. 0. 0. 1000.]] (4, 4)
step2:设计过程模型和过程噪声协方差矩阵
设计卡尔曼滤波器时,必须定义两个线性函数,如下图:
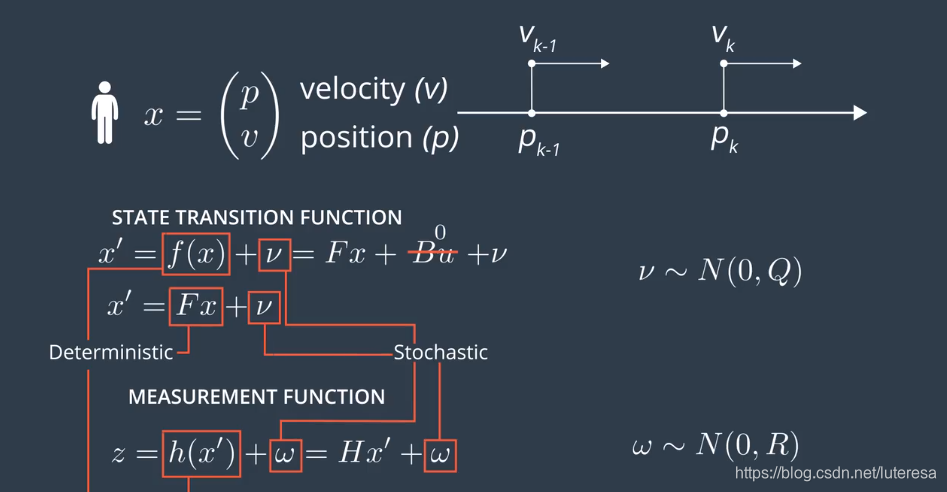
状态转移函数F:该函数对从时间k-1到时间k的状态变换进行建模;
测量函数H: 该函数对测量值的计算方式,以及测量值和预测值状态x的关联进行建模;
这些函数的第一部分F,H是模型中的确定性部分,尾项噪声v和噪声w表述的时随机部分,影响预测和测量更新步骤的随机误差;
(1)假设运动为恒速模型,即行人速度不变,过程模型可以描述如下
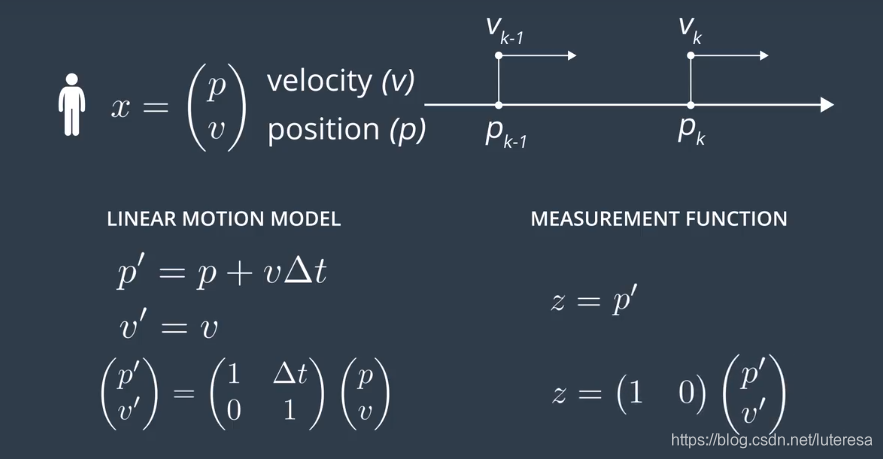
即运动模型为:
$$
x_k+1 = \left[\begin{matrix}
1.0&0.&dt&0.\
1.0&0.&0.&dt\
0&0&1&0 \
0&0&0&1 \
\end{matrix}
\right]*\left[\begin{matrix}
p_x\
p_y\
v_x \
v_y \
\end{matrix}
\right]
$$
(2)实际上行人运动过程不一定为恒速,总会有内因(行人自己加速度,无人车内部的加速度控制)和外因(风速,路面光滑程度)等影响;
内因用u表示,是行人或无人车内部控制向量,B是输入控制矩阵;
Bu表示行人由于自身内部动力,引起状态变化;
v表示由于风速,路滑等外因引起的状态变化量,是个随机变量,称为过程噪声;
对一个行人连续观察两次,获得初始速度和最终速度,根据根据动力学公式,可以推导出当前时刻状态和上一时刻状态的函数关系,
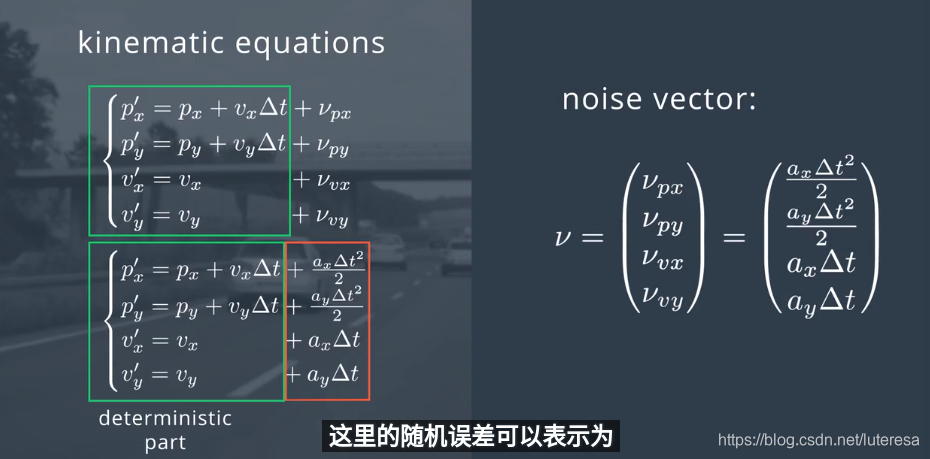
由于观测物体(行人)自身加速度无法准确和预估,应用中常设置Bu=0, 就用随机变量v(均值为0的高斯噪声)作为随机噪声;
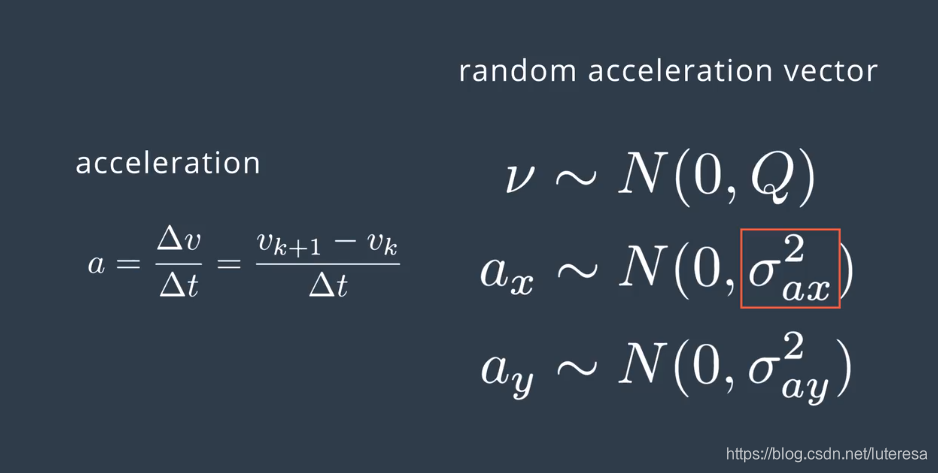
由于加速度未知,可以把加速度加到误差分量中,添加v噪声(加速度和过程噪声都用v来表征)后的过程模型为:
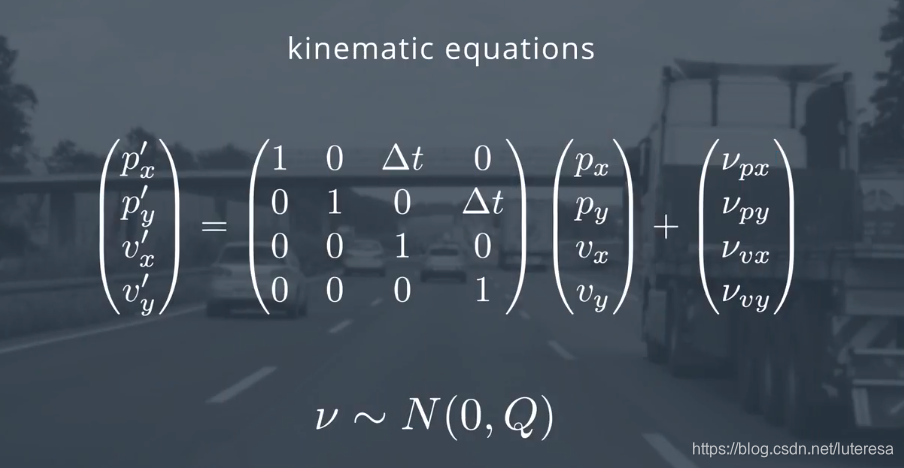
矩阵表示为:
$$
x_k+1 = \left[\begin{matrix}
1.0&0.&dt&0.\
1.0&0.&0.&dt\
0&0&1&0 \
0&0&0&1 \
\end{matrix}
\right]*\left[\begin{matrix}
p_x\
p_y\
v_x \
v_y \
\end{matrix}
\right] + \left[\begin{matrix}
\frac{1}{2}a_xdt^2\
\frac{1}{2}a_ydt^2\
a_xdt \
a_ydt \
\end{matrix}
\right]
$$
将v分解为两个分量:一个4x2的矩阵G(不包含随机变量)和一个2x1的矩阵a(包含随机加速度分量)。
根据误差向量,现在可以定义新的协方差矩阵Q:协方差矩阵定位为误差向量的期望;
因为G不包含随机变量,可以放在期望外面
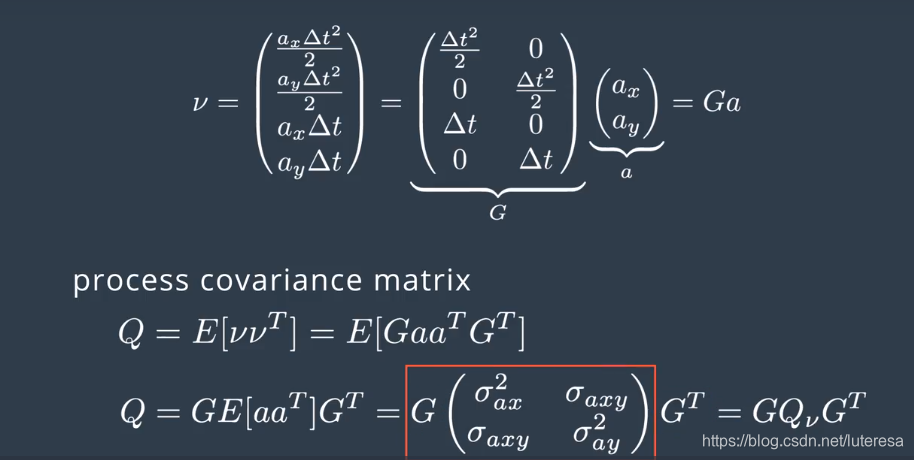
$假定a_x和ay是无关连的噪声,那么\sigma{zxy}=0$
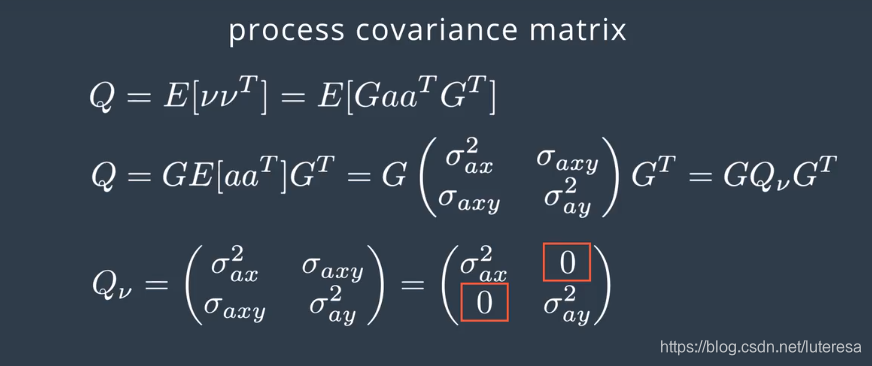
合并回原矩阵得到如下过程协方差矩阵
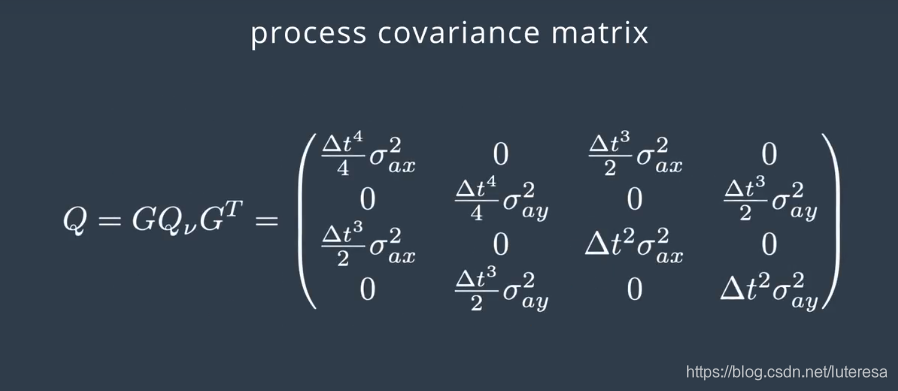
噪声Q本质上是一个均值为0的高斯分布v~N(0,Q), 卡尔曼公式2就变成:
$$
p_k^{'} = ap_ka^T + Q
$$
转移矩阵表示为:
$$
F=
\left[\begin{matrix}
1.0&0.&dt&0.\
1.0&0.&0.&dt\
0&0&1&0 \
0&0&0&1 \
\end{matrix}
\right]
$$
dt = 0.1 # Time step between Filters steps
F = np.matrix([[1.0,0.0,dt,0.0],
               [0.0,1.0,0.0,dt],
               [0.0,0.0,1.0,0.0],
               [0.0,0.0,0.0,1.0]])
print(F,F.shape)
执行结果:
[[1. 0. 0.1 0. ]
[0. 1. 0. 0.1]
[0. 0. 1. 0. ]
[0. 0. 0. 1. ]] (4, 4)
‘’‘
sv = 0.5
G = np.matrix([[0.5*dt**2],
              [0.5*dt**2],
              [dt],
              [dt]])
Q = G*G.T*sv*2
from sympy import Symbol, Matrix
from sympy.interactive import printing
printing.init_printing()
dts = Symbol('dt')
’‘’

noise_ax=0.5
noise_ay=0.5
dt_2 = dt*dt;
dt_3 = dt_2 *dt;
dt_4 = dt_3*dt;

Q = np.matrix([[0.25*dt_4*noise_ax,0,0.5*dt_3*noise_ax,0],
               [0, 0.25*dt_4*noise_ay,0, 0.25*dt_3*noise_ay],
               [dt_3/2*noise_ax, 0, dt_2*noise_ax, 0],
               [0, dt_3/2*noise_ay, 0, dt_2*noise_ay]])
执行结果:
[[0.09 0. ]
[0. 0.09]] (2, 2)
step3: 设计测量模型,观测噪声
(1)使用传感器可以直接测量行人的速度Vx, Vy,
$$
Z=
\left[\begin{matrix}
v_x\
v_y\
\end{matrix}
\right]
$$
(2) 测量矩阵可以表示为:
$$
H=
\left[\begin{matrix}
0&0&1&0\
0&0&0&1 \
\end{matrix}
\right]
$$
(3)测量噪声的协方差矩阵为:
$$
R=
\left[\begin{matrix}
\sigma_{vx}^2&0\
0&\sigma{v_y}^2 \
\end{matrix}
\right]
$$
$\sigma_{vx}^2, \sigma{v_y}^2$描述了传感器的测量有“多差”,是传感器固有性质,一般有厂商提供
H = np.matrix([[0.0,0.0,1.0,0.0],
               [0.0,0.0,0.0,1.0]])
print(H, H.shape)
ra = 0.09 #厂商提供
R = np.matrix([[ra,0.0],
              [0.0,ra]])
print(R,R.shape)
执行结果:
[[0. 0. 1. 0.]
[0. 0. 0. 1.]] (2, 4)
[[0.09 0. ]
[0. 0.09]] (2, 2)
I = np.eye(4)
print(I, I.shape)
执行结果:
[[1. 0. 0. 0.]
[0. 1. 0. 0.]
[0. 0. 1. 0.]
[0. 0. 0. 1.]] (4, 4)
一些过程值,用于结果显示
xt = []
yt = []
dxt = []
dyt = []

Zx = []
Zy = []

Px = []
Py = []
Pdx = []
Pdy = []

Rdx = []
Rdy = []

Kx = []
Ky = []
Kdx =[]
Kdy = []

def save_states(x,Z,P,R,K):
    xt.append(float(x[0]))
    yt.append(float(x[1]))
    dxt.append(float(x[2]))
    dyt.append(float(x[3]))

    Zx.append(float(Z[0]))
    Zy.append(float(Z[1]))

    Px.append(float(P[0,0]))
    Py.append(float(P[1,1]))
    Pdx.append(float(P[2,2]))
    Pdy.append(float(P[3,3]))

    Rdx.append(float(R[0,0]))
    Rdy.append(float(R[1,1]))

    Kx.append(float(K[0,0]))
    Ky.append(float(K[1,0]))
    Kdx.append(float(K[2,0]))
    Kdy.append(float(K[3,0]))
step4: 卡尔曼公式
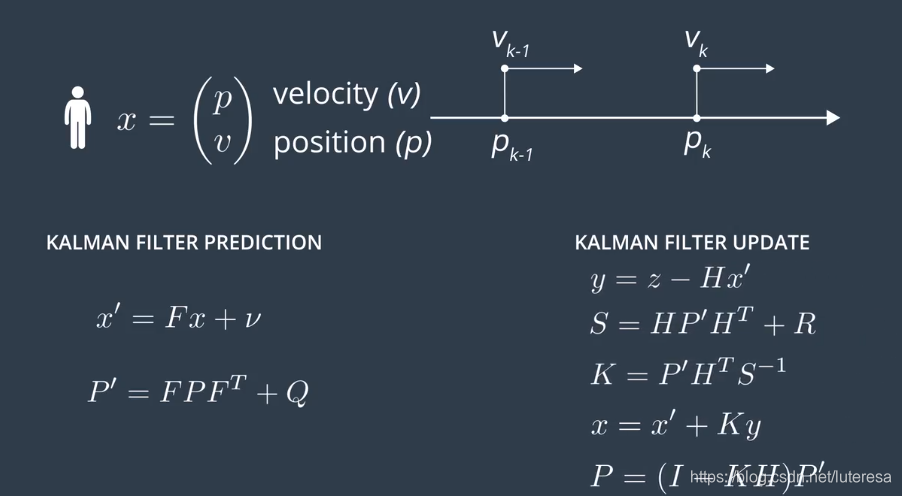
for n in range(len(measurements[0])):
    #Time Update(Prediction)
    # ==============================
    x = F*x             #Project the state ahead
    P = F * P *F.T + Q  #Project the error covariance ahead

    # Measurement Update (Correction)
    #==============================
    S = H*P*H.T + R
    K = (P*H.T)*np.linalg.pinv(S)

    #Update the estimate via z
    Z = measurements[:,n].reshape(2,1)
    y = Z - (H*x)
    x = x + (K*y)

    #update the error convariance
    P = (I - (K*H))*P

    #save states (for Plotting)
    save_states(x,Z,P,R,K)
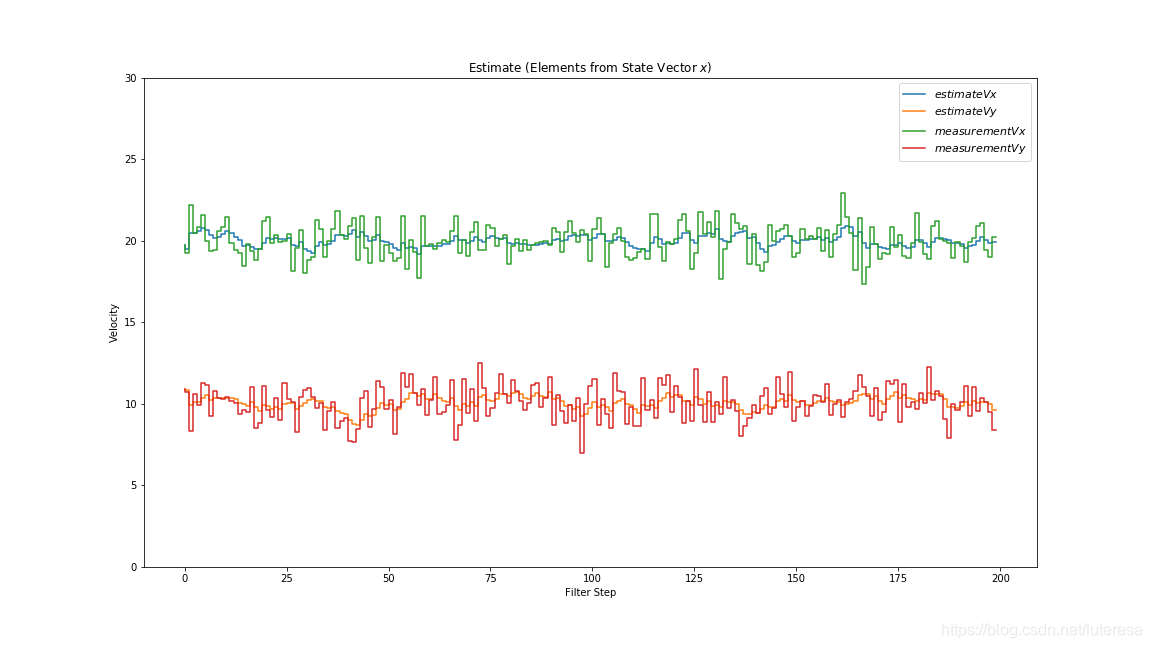
def plot_x():
    fig = plt.figure(figsize=(16,9))
    plt.step(range(len(measurements[0])), dxt, label='$estimateVx $')
    plt.step(range(len(measurements[0])), dyt, label='$estimateVy $')

    plt.step(range(len(measurements[0])),measurements[0],label='$measurementVx$')
    plt.step(range(len(measurements[0])),measurements[1],label='$measurementVy$')

    #plt.axhline(vx, colors='#999999',label = '$trueVx$')
    #plt.axhline(vy, colors='#999999',label = '$trueVy$')

    plt.xlabel('Filter Step')
    plt.title('Estimate (Elements from State Vector $x$)')
    plt.legend(loc='best',prop={'size':11})
    plt.ylim([0,30])
    plt.ylabel('Velocity')
plot_x()
卡尔曼滤波关于速度的估计结果
def plot_xy():
    fig = plt.figure(figsize=(16,9))
    plt.scatter(xt,yt,s=20,label='State', c = 'k')
    plt.scatter(xt[0],yt[0],s = 100, label='Start', c = 'g')
    plt.scatter(xt[-1], yt[-1],s=100,label='Goal', c = 'r')

    plt.xlabel('X')
    plt.ylabel('Y')
    plt.legend('Position')
    plt.axis('equal')

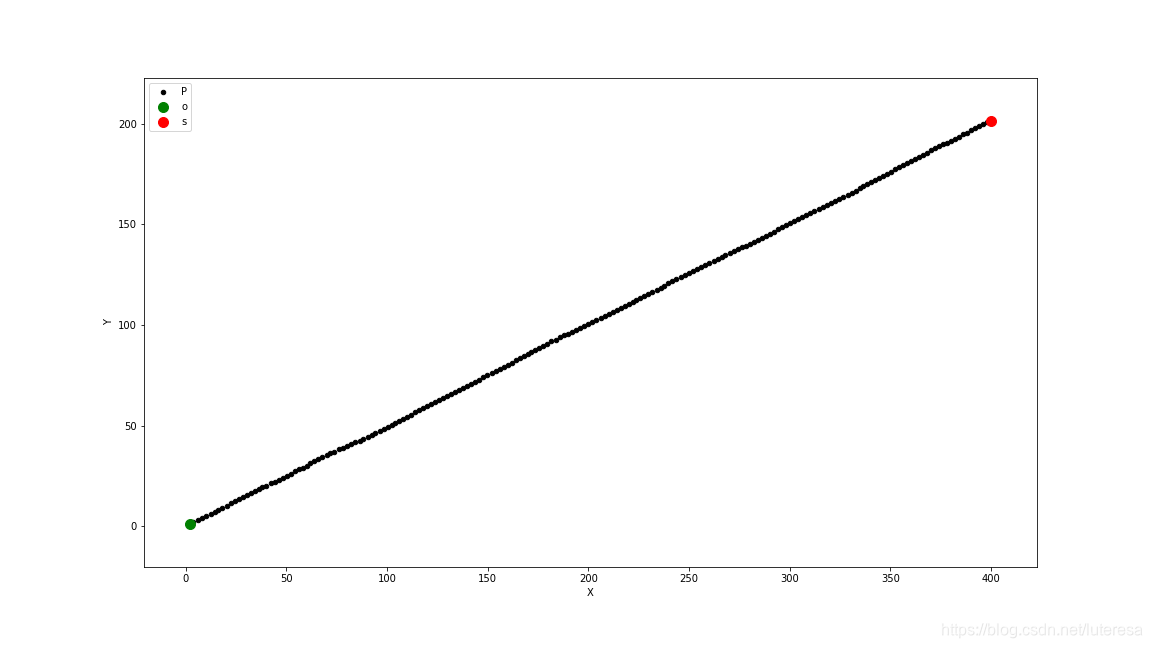
plot_xy()
卡尔曼滤波位置估算结果:
