机器学习的两大领域是分类和回归:
分类:是回答yes or no问题,比如这封邮件是不是垃圾邮件;
回归:解决的是程度问题("how much" questions),比如这个房子多少钱,一个视频会被播放多少秒?
先学习线性回归问题,然后如何优化,最后如何泛化到非线性例子。
1.用数据拟合直线
首先随意初定一条直线

观测每个数据点,根据观测值调整直线。
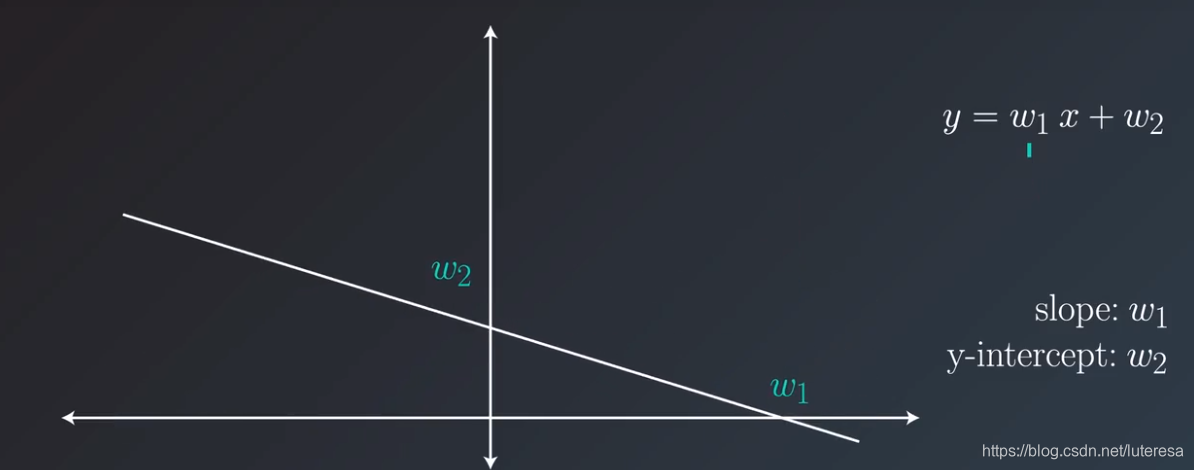
2.直线移动
调整参数w1,w2值,分别调整直线的斜率和y轴截距。
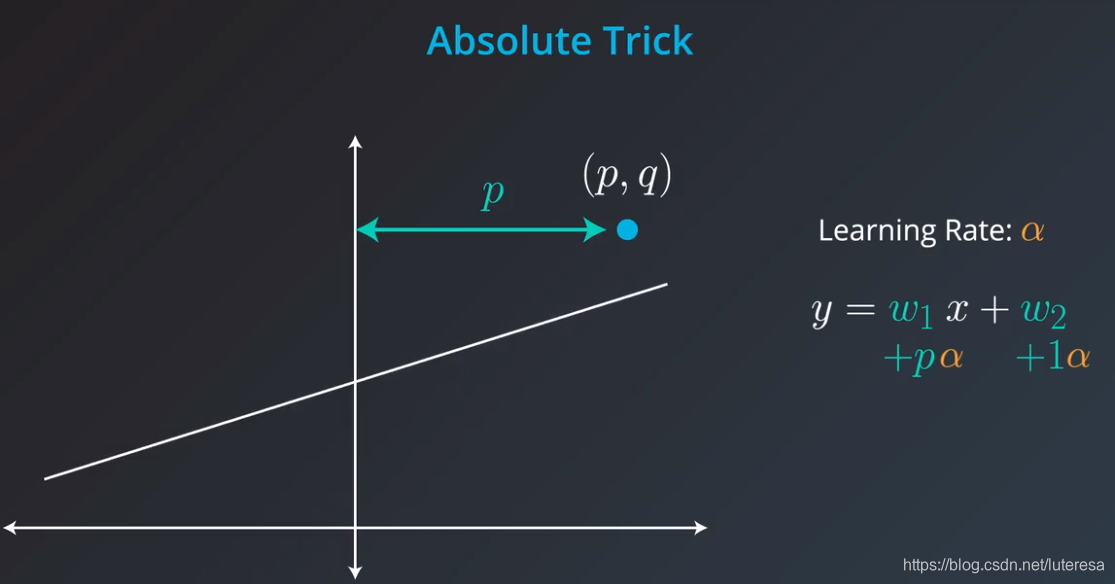
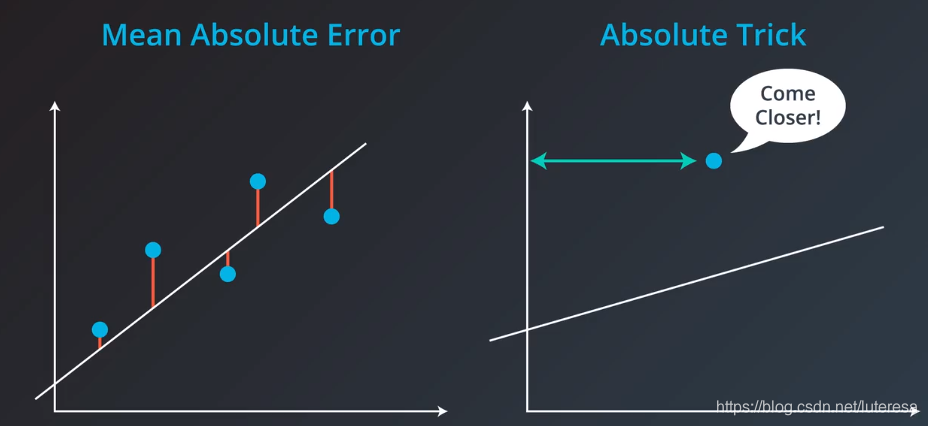
3.绝对值技巧
假如点位于直线上方,可以这样调整直线
点位于直线下方:
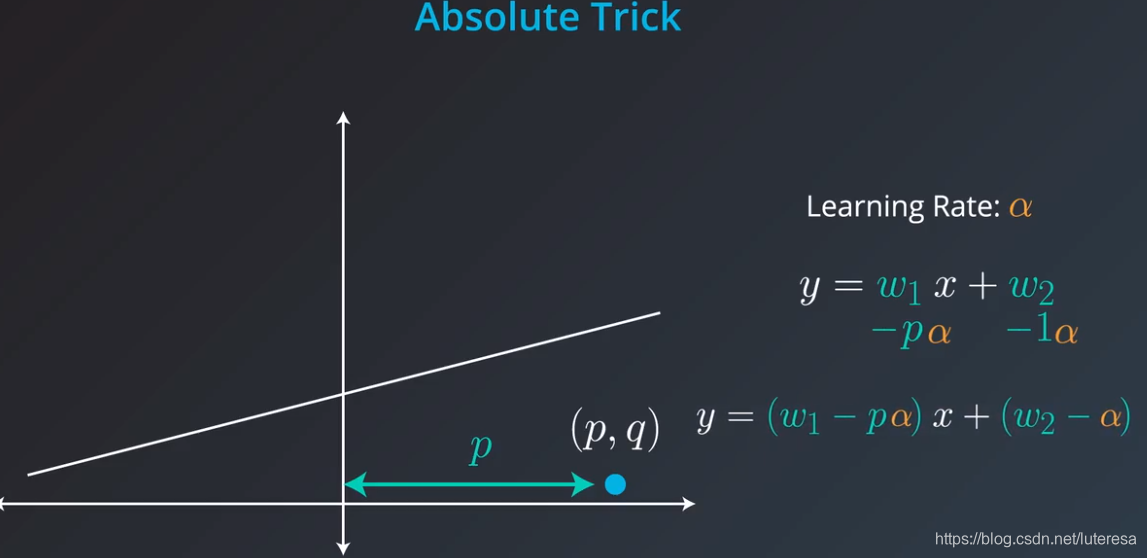
4.平方技巧

这种方法,可以忽略掉点在直线下方的情况。
#绝对值方法测试
v=[[2,-2],[5,6],[-4,-4],[-7,1],[8,14]]
m = len(v)
sum = 0
for item in v:
    x,y = item[0],item[1]

    y_hat = 1.2*x + 2
    sum += abs(y_hat - y)

print(sum/m)3.88#平方方法测试
v=[[2,-2],[5,6],[-4,-4],[-7,1],[8,14]]
m = len(v)
sum = 0
for item in v:
x,y = item[0],item[1]
y_hat = 1.2*x + 2
sum += (y_hat - y)**2
print(sum/(2*m))10.6920000000000025.梯度下降法
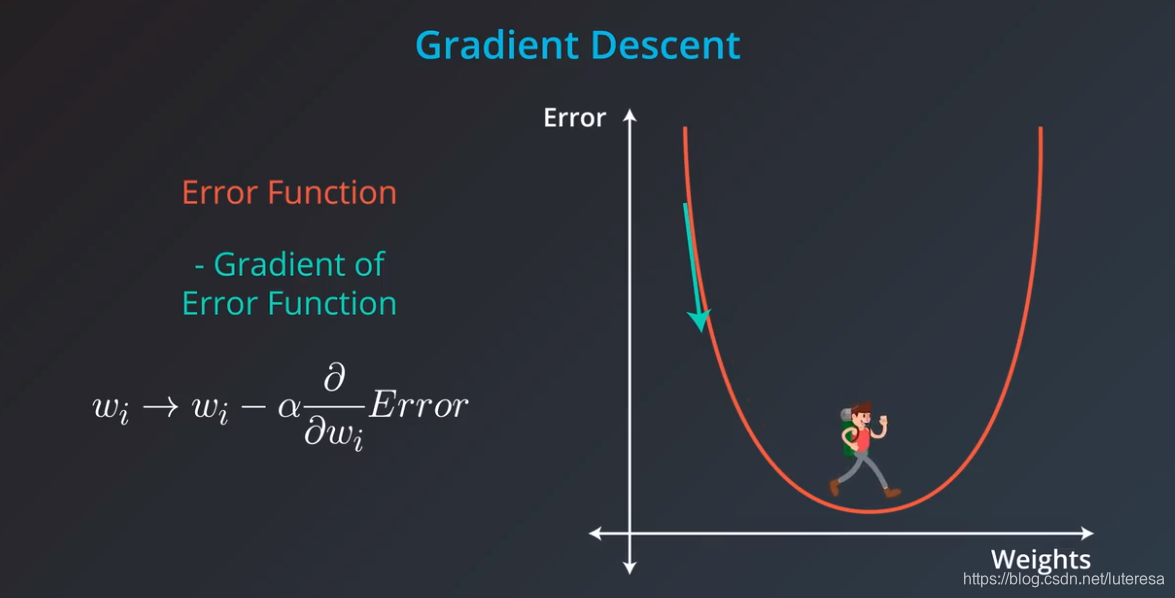
梯度下降的工作方式就像下山,
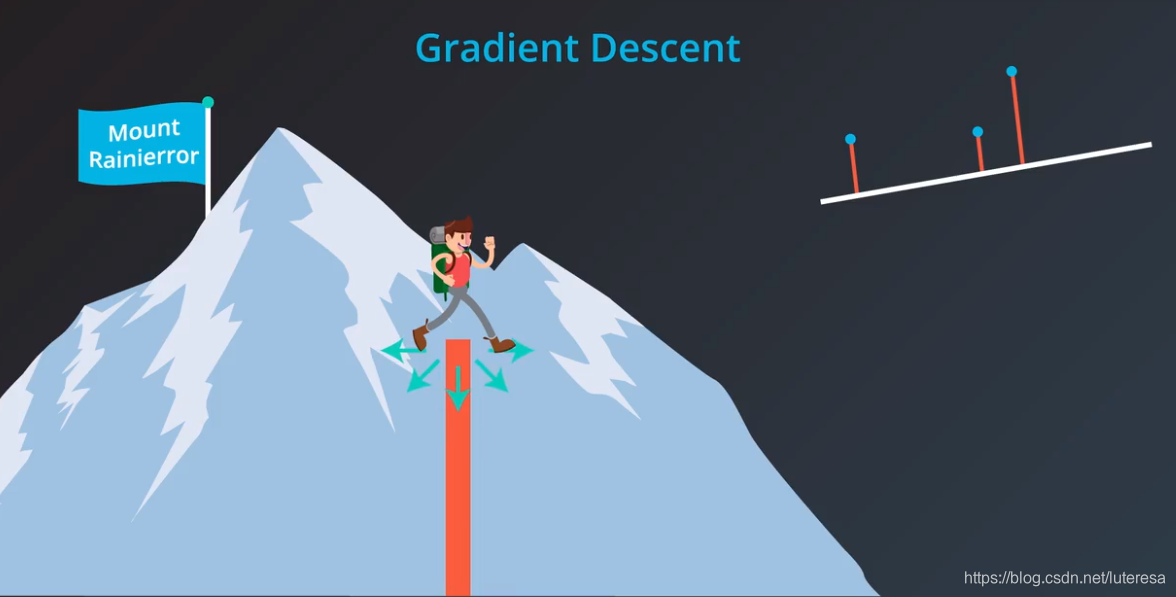
误差就像这座山,要下山,需要减少高度,下山等价于线性拟合问题,不停的重复寻找下山最快的路(梯度方向),当到达山底,也找到了最佳拟合线,这就是梯度下降。
用数学语言描述,下山方法,就是计算误差函数关于每个权重的梯度,梯度方向总是指向误差函数增大(或减小)最多的方向。
沿着梯度走一步,表示用原权重$w_i$,减去误差相对于权重$w_i$的梯度。实际上还要用学习速率乘以误差的梯度,来控制步长。
这样误差函数不断减小,接近最小值。重复这一过程,就可以得到误差最小或很好的值。
6.平均绝对值误差
计算方法:
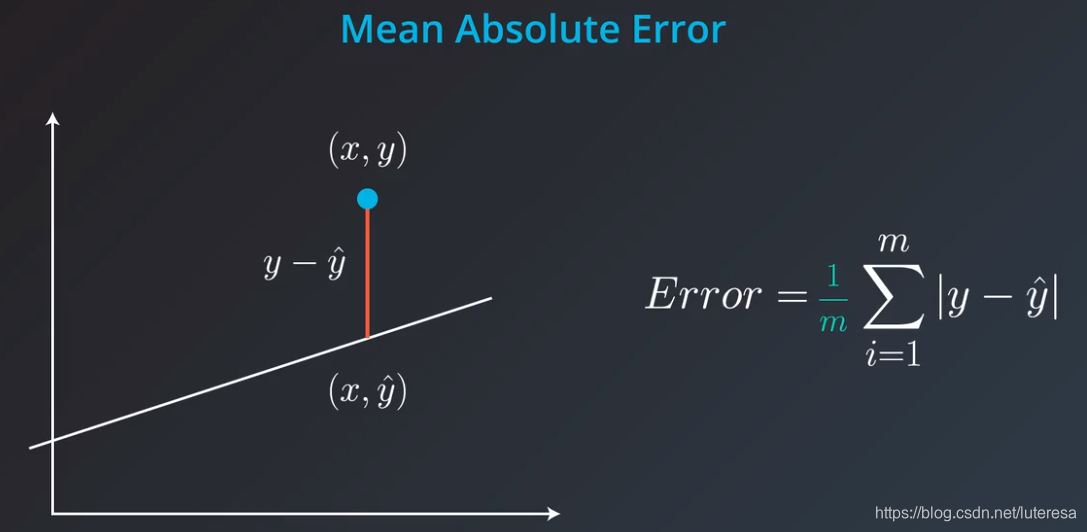
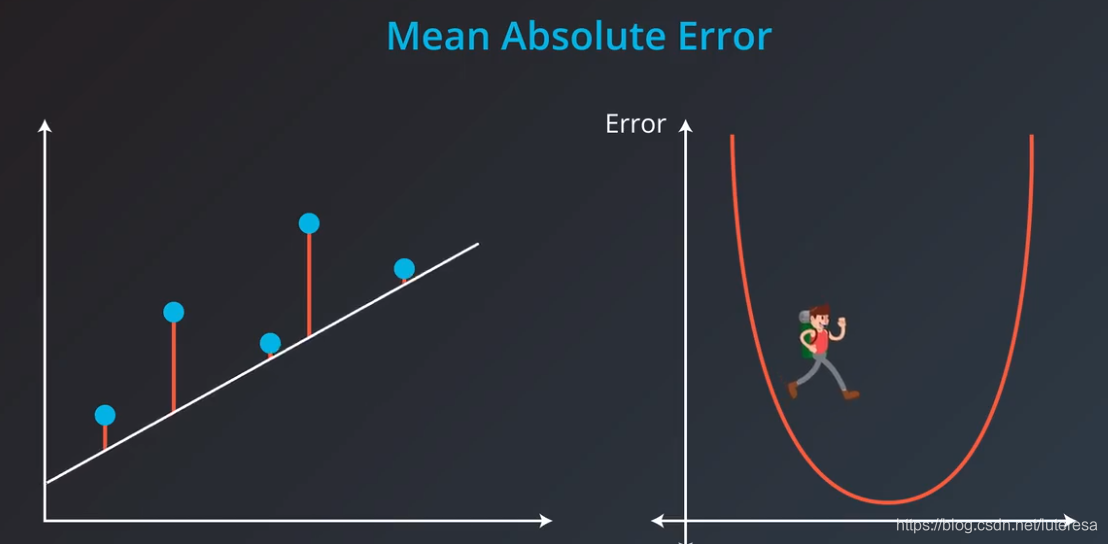
用简化的二维图,展示用梯度下降法拟合最佳直线
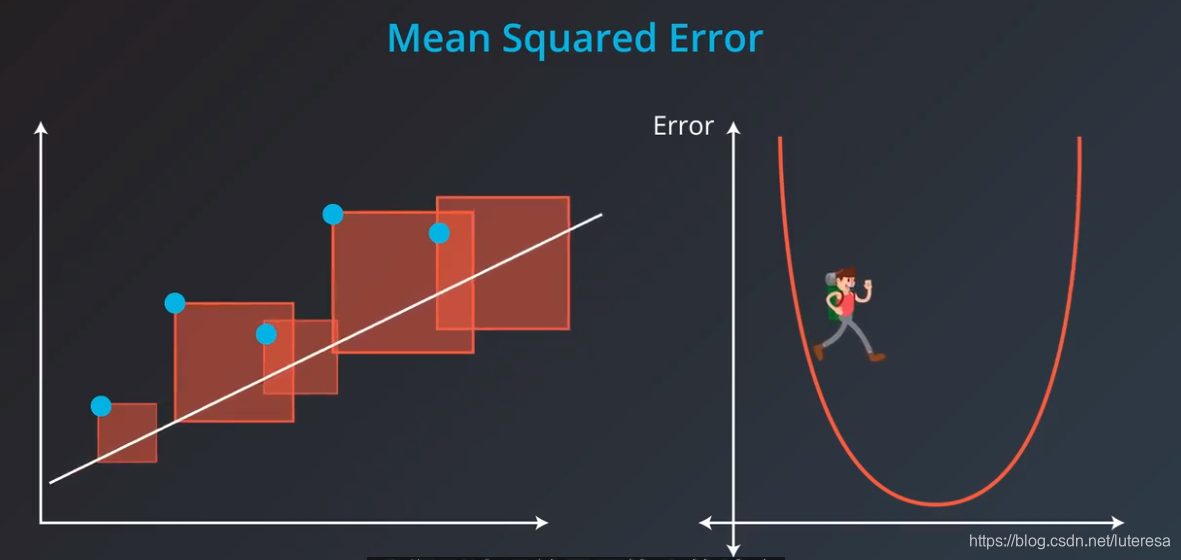
7.均方误差
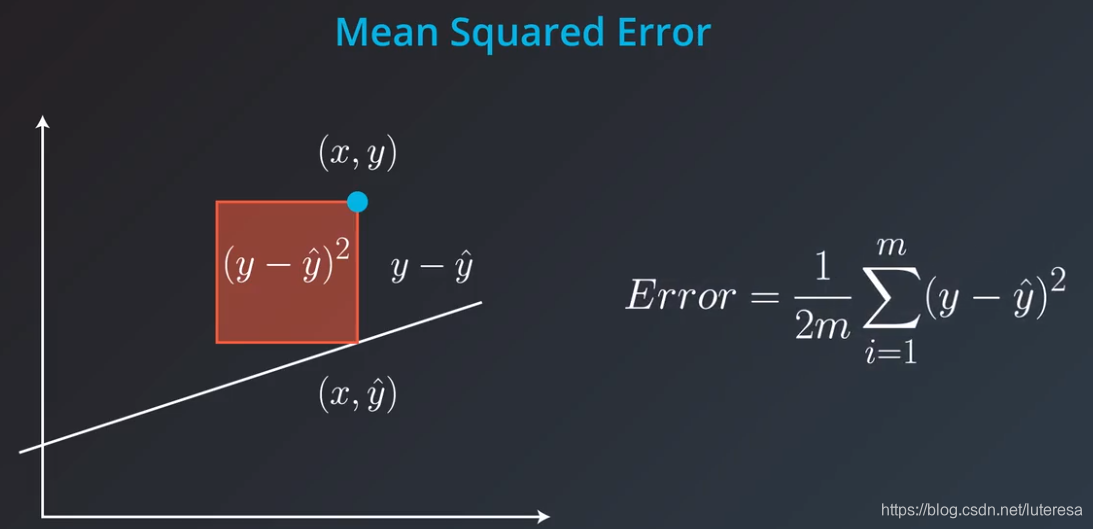
计算方法:
这里的1/2是为了方便后续导数计算,对收敛过程每任何影响。
用简化二维图展示,梯度下降法拟合最佳直线
8.最小化误差函数
目前学习了两个算法,用于拟合直线,
其一是使用绝对值技巧和平方技巧,
其二时最小化任意误差函数,即平均绝对误差和均方误差,
其实,这两个方法完全相同:
梯度下降法,最小化平均绝对误差与绝对值技巧完全相同;
梯度下降法,最小化均方误差与平方技巧完全相同;
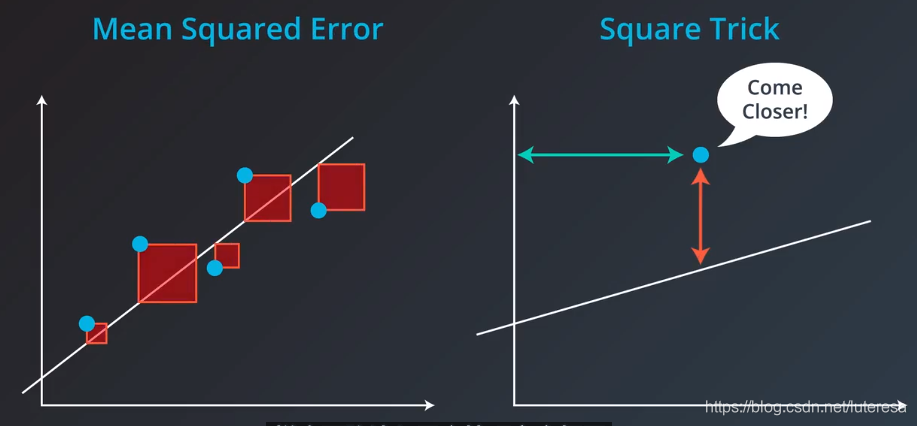
以均方误差为例,梯度下降中,最小误差函数分别对斜率$w_1$和y轴截距$w_2$的导数,刚好就是点到直线的垂直距离,和到y轴的距离。这与平方技巧完全相同。

绝对值误差同理,注意符号问题。
误差函数求导过程
误差定义如下:
$$
Error = \frac{1}{2}(y - \hat{y})^2
$$
预测函数为:
$\hat{y} = w_1x + w_2$
因此,误差函数对$w_1$求导:
$$
\frac{\partial}{\partial w_1}Error = \frac{\partial Error}{\partial\hat{y}} \frac{\hat{y}}{\partial w_1} \
= -(y - \hat{y}) w_1
$$
因此,误差函数对$w_2$求导:
$$
\frac{\partial}{\partial w_2}Error = \frac{\partial Error}{\partial\hat{y}} \frac{\hat{y}}{\partial w_2} \
= -(y - \hat{y})
$$
ps: 均方误差和总平方误差本质是一样,因为误差结果是线性的,选择哪个,只是选择了不同的学习速率。
在现实中,我们可以借助算法判断什么样的学习速率合适。
9.小批量梯度下降法
随机梯度下降法:逐个地在每个数据点应用均方(或绝对)误差,并重复这一流程很多次。
批量梯度下降法:同时在每个数据点应用均方(或绝对)误差,并重复这一流程很多次。
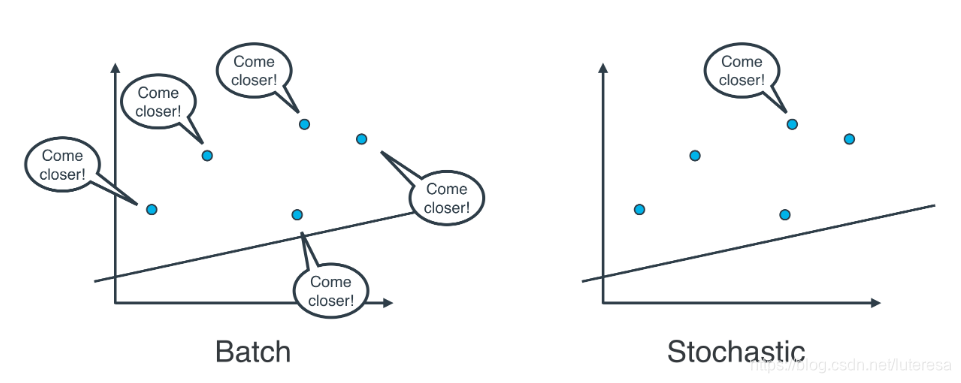
实际上,在大部分情况下,两种都不适用,思考以下情形:如果你的数据十分庞大,两种方法的计算速度都将会很缓慢。
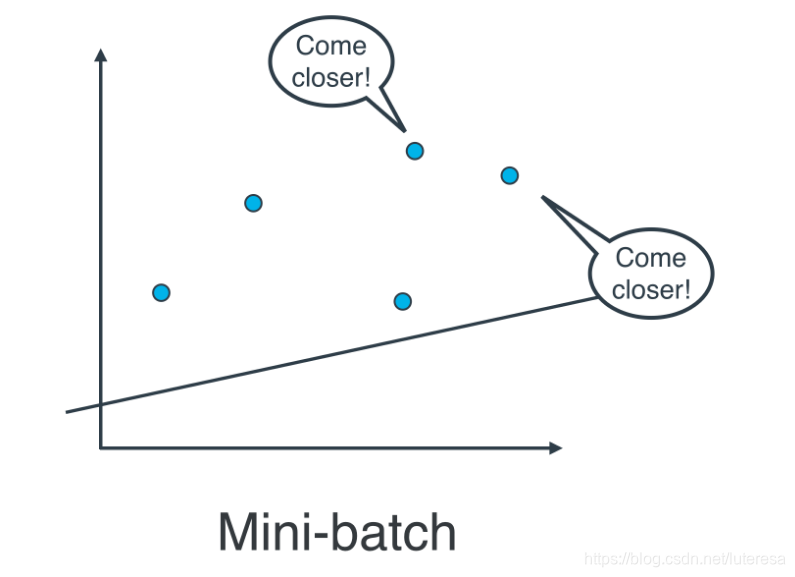
线性回归的最佳方式是将数据拆分成很多小批次。每个批次都大概具有相同数量的数据点。然后使用每个批次更新权重。这种方法叫做小批次梯度下降法。
使用小批次梯度下降法,特别注意一点,所有数据样本,应该随机采用分批次。
import numpy as np
%matplotlib inline
# Setting a random seed, feel free to change it and see different solutions.
np.random.seed(42)

# TODO: Fill in code in the function below to implement a gradient descent
# step for linear regression, following a squared error rule. See the docstring
# for parameters and returned variables.
def MSEStep(X, y, W, b, learn_rate = 0.005):
    """
    This function implements the gradient descent step for squared error as a
    performance metric.

    Parameters
    X : array of predictor features
    y : array of outcome values
    W : predictor feature coefficients
    b : regression function intercept
    learn_rate : learning rate

    Returns
    W_new : predictor feature coefficients following gradient descent step
    b_new : intercept following gradient descent step
    """

    # Fill in code
    # compute errors
    y_pred = np.matmul(X,W) + b
    error = y - y_pred

    # compute steps
    W_new = W + learn_rate * np.matmul(error, X)
    b_new = b + learn_rate * error.sum()

    return W_new, b_new

# The parts of the script below will be run when you press the "Test Run"
# button. The gradient descent step will be performed multiple times on
# the provided dataset, and the returned list of regression coefficients
# will be plotted.
def miniBatchGD(X, y, batch_size = 20, learn_rate = 0.005, num_iter = 25):
    """
    This function performs mini-batch gradient descent on a given dataset.

    Parameters
    X : array of predictor features
    y : array of outcome values
    batch_size : how many data points will be sampled for each iteration
    learn_rate : learning rate
    num_iter : number of batches used

    Returns
    regression_coef : array of slopes and intercepts generated by gradient
      descent procedure
    """
    n_points = X.shape[0]
    W = np.zeros(X.shape[1]) # coefficients
    b = 0 # intercept

    # run iterations
    regression_coef = [np.hstack((W,b))]
    print("regression_coef:",regression_coef)
    for _ in range(num_iter):
        batch = np.random.choice(range(n_points), batch_size)
        X_batch = X[batch,:]
        y_batch = y[batch]
        W, b = MSEStep(X_batch, y_batch, W, b, learn_rate)
        regression_coef.append(np.hstack((W,b)))

    return regression_coef

if __name__ == "__main__":
    # perform gradient descent
    data = np.loadtxt('data.csv', delimiter = ',')
    print("data.type:",type(data),data.reshape)
    X = data[:,:-1]
    y = data[:,-1]
    regression_coef = miniBatchGD(X, y)

    # plot the results
    import matplotlib.pyplot as plt

    plt.figure()
    X_min = X.min()
    X_max = X.max()
    counter = len(regression_coef)
    for W, b in regression_coef:
        counter -= 1
        color = [1 - 0.92 ** counter for _ in range(3)]
        #print(color)
        plt.plot([X_min, X_max],[X_min * W + b, X_max * W + b], color = color) #color=[0.5, 0.5, 0.5]
    plt.scatter(X, y, zorder = 3)
    #plt.show()
    plt.savefig("mini_batch_GD.png")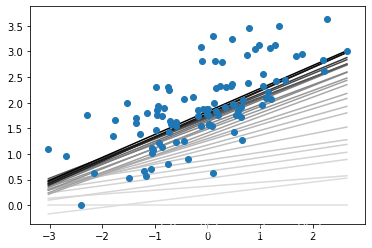
10.平均绝对值VS均方误差
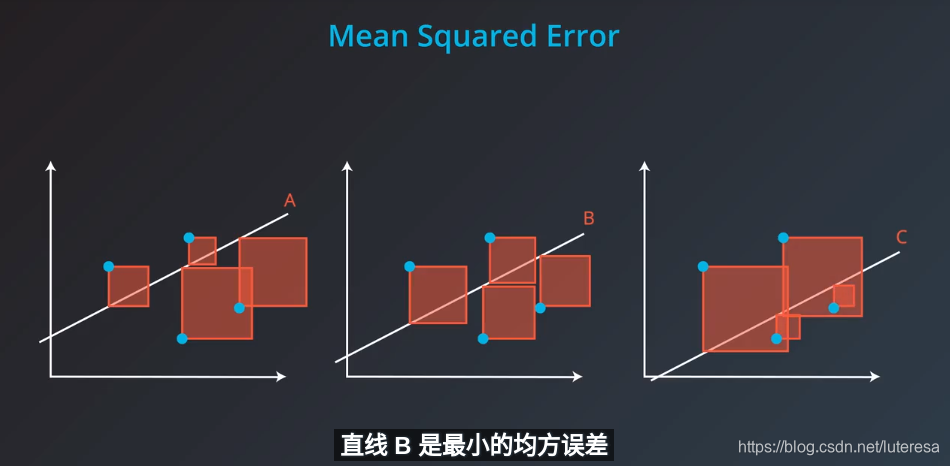
平均绝对值误差和均方误差,到底哪个更好,没有固定答案,比如下面拟合问题
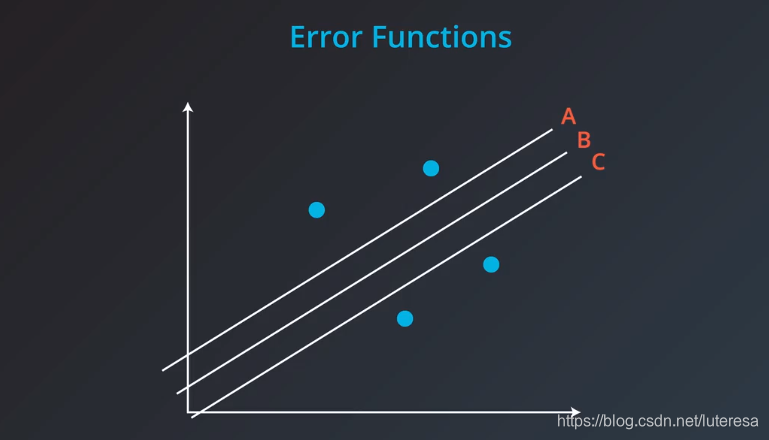
这里,三根线,绝对值误差时相等的,而均方误差不等。
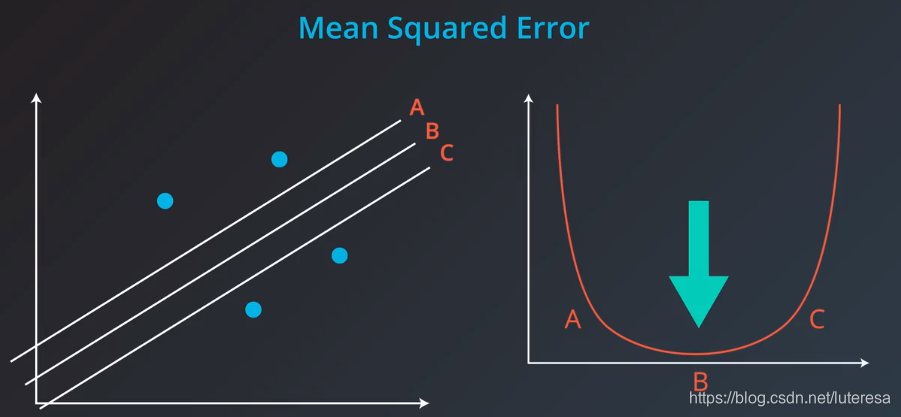
图像化观测
import numpy as np
arr1=np.array([1,2,3])
arr2=np.array([4,5,6])
print(np.vstack((arr1,arr2)))
[[1 2 3]
 [4 5 6]]
print(np.hstack((arr1,arr2)))
a1=np.array([[1,2],[3,4],[5,6]])
a2=np.array([[7,8],[9,10],[11,12]])
print(a1)
print(a2)[1 2 3 4 5 6]
[[1 2]
[3 4]
[5 6]]
[[ 7 8]
[ 9 10]
[11 12]]import numpy as np
a = [[1, 0], [0, 1]]
b = [[4, 1], [2, 2]]
np.matmul(a, b)array([[4, 1],
[2, 2]])